Friday, May 30, 2014

Week 9

This week, the biodiesel process was continued. The main focus was on washing and neutralizing the biofuel. After it settled for the weekend, the group added a very dilute sulfuric acid and water solution to neutralize the biofuel. This also was the beginning of the washing process. After shaking the biofuel and sulfuric acid solution vigorously, the water was drained and the pH was tested. If the pH was not yet neutralized, more sulfuric acid and water solution was added and the washing process was continued. Once the biofuel reached neutrality, it only needed to be washed with water.

The washing process was over once all of the water turned out clear. At this point, the biofuel needed to be dried to remove any excess water in the biofuel. In order to dry the biofuel, it was heated to just below the boiling point of water. Once this process was completed, we had our first batch of biofuel!! Figure 1 shows the unfiltered, undewatered biofuel, figure 2 shows the filtered, undewatered biofuel, and finally figure 3 shows the filtered dewatered biofuel.

Figure 1. Unfiltered, undewatered biofuel.

Figure 2. Filtered, dewatered biofuel.

Figure 3. Filtered, dewatered biofuel.

Now that we finally produced biofuel (or so we think), it was time to test the efficiency to see if we really did make biofuel. In order to do this, we used three tests: a density test,  and the 3-27 test (explained below). After talking to our graduate fellow, Megan, it was decided that the density of the biofuel should be around 0.88g/mL. Fortunately, all of the samples except Filtered Undewatered B were close to this value. This was most likely because the filter was used with water beforehand, so this sample contained a lot of water. The values of the mass, volume, and density of each sample is illustrated in figure 4.

Figure 4. Table of measured mass, volume, and density.

After the density test, the group performed the 3-27 test. This was a visual quality test. 27mL of methanol was added to 3mL of biofuel and it was shaken vigorously for thirty seconds. After allowing it to settle for five minutes, the solution was observed. If the solution was cloudy, the reaction was not complete and the biofuel was not a good quality. On the other hand, if the solution was clear, the biofuel was successfully made. After this test, the there were only two biofuels that were clear: unfiltered undewatered A and filtered dewatered B. The other three biofuels did not completely react. The solutions after this test are shown in figures 5, 6, and 7. This shows that the filtering and dewatering process effectively worked when creating the biofuel. Once again, the two samples that were filtered but not dewatered were of poor quality. 

Figure 5. Quality test of unfiltered undewatered (B is left, A is right). Only A passed the test.

Figure 6. Quality test of filtered undewatered (A is left, B is right). Both samples failed the test.

Figure 7. Quality test of filtered dewatered (A is left, B is right). Only B passed the test. 

After the tests, we wanted to see how our biofuel burned, so we selected our best sample (Filtered dewatered B) and burned it next to a sample of soybean oil. It was observed that the biofuel produced a larger flame than the soybean oil. The flames are illustrated in figure 8. However, the biofuel also produced more black smoke, but this is typical of diesel. In the end, this project was very successful and we learned a lot about the biodiesel process. 

Figure 8. Flames of canola oil (left) and biofuel (right).

Wednesday, May 28, 2014

Week 8

In lab this week, the biodiesel process was finally started! The first step in the process was to make a stock solution of KOH and methanol. From last weeks lab, it was calculated that about 3.3g of KOH would be added to 162.8g of methanol in order for an excess reaction of 150%. After mixing the KOH and methanol, being sure that it was fully dissolved, between 27.5 and 27.8 grams of the solution was added to each sample of oil. However, there was a mistake in the calculation, and the Filtered Dewatered Sample B received 37.9g of the solution. Figure 1 shows the amount of solution added to each sample (the column furthest to the right).

Figure 1. Table of amount of KOH and methanol used.

After adding the KOH and methanol solution to each sample, the solution was placed in the shaker bath for an hour so that the reaction could occur completely. The results of the reaction did not seem normal. The figures below illustrate each sample after an hour in the shaker bath. The unfiltered, undewatered solutions had two layers, as shown in figure 2. The filtered, undewatered samples both also had two layers, as illustrated in figure 3. Finally, the filtered, dewatered sample had two layers, but the one sample had a pink layer, as shown in figure 4. This pink layer was probably from residue left on the stopper from a previous experiment.

Figure 2. Unfiltered Undewatered.

Figure 3. Filtered Undewatered.

Figure 4. Filtered Dewatered.

At this point in the experiment, the solutions would need to sit in separatory flasks so that the glycerin layer could be removed from the biodiesel layer. However, after letting the solutions sit for four days, an odd result happened. Five of the six solutions separated so that the glycerin was on top. This is backwards to most biodiesel reactions. The only solution that correctly separated was the Filtered Dewatered B, which was the solution that had extra KOH and methanol added to it. As a result, it was concluded that the reaction did not occur completely, and more KOH and methanol would need to be added. After creating another batch of KOH and methanol (the same proportionality as before), equal amounts were added to each solution and they were again placed in the shaker bath. This time, the reaction seemed to have worked! Now, the solutions were ready to be washed. 

After allowing the solutions to sit over the weekend, the glycerin layer was clearly on the bottom of the biodiesel layer, as shown in figure 5. The filtered dewatered and filtered undewatered all reacted the same, as shown in figure 6. As stated above, next week, the biodiesel will be separated from the glycerin and the washing process will be started. After this, we will test the efficiency of the biofuel to see how well the filter actually worked. 

Figure 5. Unfiltered Undewatered after reaction.

Figure 6. Filtered dewatered after reaction.

Monday, May 26, 2014

Week 7

This week, the group started calculations for how much KOH and methanol would be needed to create bio fuel. In order to do the calculations, we first met with Dr. Cairncross to discuss the chemical reactions that occur in the bio diesel process. The two main reactions are shown below:

FFA (free-fatty acid) + KOH ----> "soap"
TAG + 3CH_3OH ----> 3 FAME

After figuring out the two chemical reactions, stoichiometry was completed to calculate the mass of KOH and methanol that would be needed. The calculations are shown in figure 1 (if needed, zoom in to see the calculations more clearly, however, since this is not a major focus of the project, not much emphasis will be put in this section). Even though we are going to make one combined batch of KOH and methanol solution, the calculations provided insight of how much of each chemical should be used for a single batch of bio diesel.

Figure 1. Calculations of mass of KOH and methanol needed.


Finally, in the lab, we started measuring out various samples of the waste oil so that they would be ready for the bio diesel production process, which would happen next week. Two samples of each type of waste oil (unfiltered undewatered, filtered undewatered, and filtered dewatered) were measured out to ensure accurate results. Based on the amount of oil we had, it was decided that 100g of each sample would be necessary. Next week, we will begin creating bio diesel!

Monday, May 12, 2014

Week 6

The grease was acquired from the Spot Burger food truck on Tuesday, May 6th. The team began testing the filtration system we developed and tried to differentiate the filtrated grease from the original grease. We used a lamp to see how light would deflect through the grease. The team discovered that the huge chunks of grease were easily filtered out and the grease was slightly less viscous. However the "new", filtered grease looked cloudy and unclear compared to the original grease, but this could be due to the air particles that are in the grease. Allowing the grease to settle should clear up the grease.

After allowing the filtered grease to settle for the weekend, we noticed that there was a lot of water that settled on the bottom. This was perhaps a cause of the cloudiness of the waste grease.

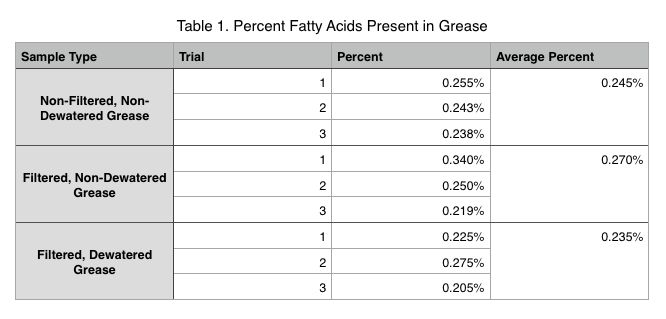
During the lab period this week, the group was able to work on dewatering and testing the fatty acid number of the waste grease. We tested three trials of three different samples of the waste grease. The three samples were the unfiltered waste grease, the filtered waste grease before dewatering, and finally, the filtered waste grease after dewatering. In order to test the fatty acid number, a simple titration was completed.


All of these values for percent fatty acids present in the grease are very similar which makes sense because all of the grease is from the same sample and even those that have been filtered and dewatered still contain the same amount of fatty acids present. The small differences are due to experimental error and, perhaps, not using large enough samples since our values are so small.

In order to dewater the filtered waste grease, it was placed on a hot plate and constantly stirred. The temperature of the oil was held to around 95 degrees celsius. This was to prevent the water from boiling off too quickly, causing the oil to splatter.

Figure 1. Unfiltered waste grease

Figure 2. Filtering of waste grease in gravel filter.


Figure 3. Filtering of waste grease in the small gravel filter.

Figure 4. Waste grease after gravel filter.

Figure 5. Single layer cheesecloth filtering.

Figure 6. Waste grease after filtering through single layer of cheesecloth and gravel filter.

Figure 7. Waste particles that collected on single layer of cheesecloth.

Figure 8. Final filtering of oil through cheesecloth (5 layers).

Figure 9. Waste grease after final filtering (final product, ready for dewatering).


Figure 10. All three samples of the waste grease. Before filtering (left), after filtering (center), and after filtering and dewatering (right).


Friday, May 2, 2014

Week 5

Now that the lab section is halfway over, the group really had to start making big moves this week so we could start testing our filtering process. Throughout the weeks, some of the group members tried to contact food trucks for waste grease. Most of the trucks said that they had no way of giving us the grease. Fortunately, during the lab section this week, all four of us were able to go on Market Street and ask around for some waste grease. During this search, the food truck "Say Cheese" offered us their waste grease, but said that it would be over 300 degrees fahrenheit. Unfortunately, we have nothing to hold such a hot grease, so we had to rethink.

After talking to Megan, it was decided that we would return to "Say Cheese" and ask for a cooled grease sample. Once again, however, the owner said that he would not have enough grease for us. Luckily, he referred us to another food truck "Spot Burger" and we were able to talk to the owner. He told us that he had no waste grease at the moment, but he could bring us some Tuesday afternoon. Finally, the group would have some waste grease to begin testing!

In addition to finally finding grease, we also borrowed a ring stand and a bucket from the lab. The ring stand will hold our filter system, and the bucket may be used to store the grease. Testing of the filter can finally begin on Tuesday!